ENVB 30030 Ecology and its application: Population Ecology Practical Assignment Questions 2026 | UCD
| University | University College Dublin (UCD) |
| Subject | ENVB 30030 Ecology and its application: Population Ecology |
ENVB 30030 Practical Assignment Questions
Three exercises are to be completed for the practical assignment. Please use the excel file provided to insert your calculations & graphs and answers to each of the questions: ‘Pop_Ecol_Assignment_Answer_Sheets.xls’. Please try keep changes to the file to a minimum to facilitate grading
Exercise I a: (Total marks 24)
You are presented with the following Table, which includes the catch (per 100 hours of trawling) of plaice (Pleuronectes platessa) in the southern North Sea for six fishing seasons. Estimate the survival and mortality rate of each age category using 1) the data from any one of the six years, 2) using the average over the six years, show results in a Table. Using these figures plot the catch data in a graph (Age vs Number caught) for both the average of the six years and any one year. Answer the questions that follow (EIa Q 1-5).
Table 1: Catch data for plaice caught during surveys conducted in the North Sea over a six year period from 1990 to 1996
| Catch | ||||||
| Age of Plaice | 1990-1991 | 1991-1992 | 1992-1993 | 1993-1994 | 1994-1995 | 1996-1997 |
| I | 0 | 0 | 0 | 0 | 0 | 0 |
| II | 39 | 91 | 142 | 200 | 99 | 110 |
| III | 929 | 559 | 999 | 1101 | 1130 | 945 |
| IV | 2320 | 2576 | 1424 | 3010 | 2508 | 3421 |
| V | 1722 | 2055 | 2828 | 2098 | 1890 | 2838 |
| VI | 389 | 982 | 1309 | 800 | 879 | 1102 |
| VII | 198 | 261 | 519 | 367 | 310 | 601 |
| VIII | 93 | 152 | 123 | 210 | 154 | 250 |
| IX | 95 | 71 | 106 | 113 | 120 | 123 |
| X | 81 | 57 | 61 | 98 | 89 | 100 |
| XI | 57 | 60 | 40 | 45 | 43 | 65 |
| Older | 94 | 87 | 99 | 110 | 54 | 123 |
Exercise 1:
Q1: What formula did you use to calculate the mortality and survival rate for each age category? (2 Marks)
Q2: Was the survival/mortality rate the same for each age category? (2 Marks)
Q3: Why do the survival/mortality rates differ when the average data or the data pertaining to one particular year is used? (10 Marks – show table – see above in exercise 1a description)
Q4: How reliable is the estimate for the 1st three and last age category? (5 marks)
Q5 Describe the population age structure. (3 Marks) Have you concerns about the age structure as presented in terms of it reflecting this species true population structure? (2 Marks)
Exercise I b: (Total Marks 27)
Reproductively active individuals in this population have been tagged and tracked to spawning grounds in three localities near estuaries in Scotland. During the six year period of the North Sea survey in-shore netting surveys were conducted at the three estuaries to estimate the plaice population. The table below includes the total number of individuals caught in the three bays categorized by age. Estimate the survival and mortality rate of each age category using 1) the data from any one of the six years, 2) using the average over the six years. Combine the appropriate data from Table 1 & 2 to draw a graph showing the survivorship curve of this species, start with a hypothetical population size of 1000000 individuals. Answer the questions that follow (EIb question 6-9).
Table 2: Catch data for plaice caught during in-shore surveys conducted in three estuaries in Scotland over a six year period from 1990 to 1996.
| Catch | ||||||
| Age of Plaice | 1990-1991 | 1991-1992 | 1992-1993 | 1993-1994 | 1994-1995 | 1996-1997 |
| I | 65000 | 110000 | 152000 | 98000 | 189000 | 89000 |
| II | 12000 | 23000 | 18000 | 12012 | 23000 | 8067 |
| III | 4000 | 5012 | 4590 | 5042 | 3570 | 2189 |
| IV | 245 | 111 | 13 | 112 | 200 | 16 |
| V | 15 | 32 | 16 | 13 | 34 | 13 |
| VI | 33 | 0 | 40 | 12 | 40 | 0 |
| VII | 23 | 25 | 13 | 0 | 8 | 43 |
| VIII | 12 | 45 | 23 | 32 | 16 | 23 |
| IX | 21 | 0 | 22 | 0 | 18 | 12 |
| X | 15 | 3 | 9 | 30 | 32 | 32 |
| XI | 0 | 18 | 12 | 16 | 44 | 0 |
| Older | 32 | 21 | 56 | 33 | 20 | 28 |
Q6: What is the mortality rate of a two year old individual? (10 Marks – show table with calculations)
Q7: Which estimate would you use for three year old individuals Table 1 or Table 2 or a combination of both or can you combine these? (5 Marks)
Q8: At what age does this population suffer the highest mortality rate? (2 Marks)
Q9: What type of survivorship curve does this species have? (10 Marks – include graph of the survivorship curve)
Exercise II: (Total marks 32)
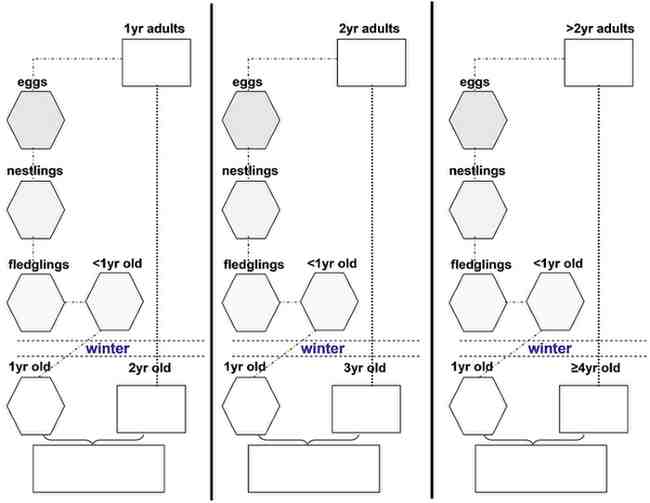
You are presented with two life tables for a golden weaver. One that relates to the survivorship of the immature individuals of a population (Table 3) and one that relates to the survivorship and reproductive output of adult individuals (year 1, 2 and >2years) (Table 4). In the blank diagram following the tables show your calculations of how a population of weaver birds (time t) that consists of 112 1yr old, 158 2yr old, 110 3yr old, 58 4yr old and 76 5yr old individuals may grow to the following generation (time t+1). Answer the questions that follow (EII Q1-5). We will assume a 50:50 sex ratio in this exercise. If you prefer you can use the diagram provided to complete the calculations in excel and copy paste it once complete.
Table 3 Life table scheduling the mortality (qx) and survival rates (px) for phases in the immature life stage of the golden weaver’s life cycle
| x (stage) | qx | px | mx |
| Egg | 0.05 | 0.95 | 0 |
| Nestling | 0.2 | 0.8 | 0 |
| Fledgling | 0.4 | 0.6 | 0 |
Table 4 Life table of the golden weaver, including mortality (qx), survival (px) and reproductive rates (mx) of adult individuals
| x (yr) | qx | px | mx |
| <1 | 0.7 | 0.3 | 0 |
| 1 | 0.5 | 0.5 | 2 |
| 2 | 0.4 | 0.6 | 3 |
| >2 | 0.3 | 0.7 | 3 |
NOTE – use the excel file that contains the illustration below to complete the calculations
Q1 At what stage in the life cycle of the Golden weaver does the highest mortality occur? (2 marks)
Q2 How many female offspring will survive to t+1 in this population? (10 Marks – for completed illustration showing your calculations + 5 Marks for answer to question)
Q3 What is the total population size at t+1 (include males and females)? (5 Marks)
Q4 What is the rate of increase in this population? (5 Marks)
Q5 If you manage to improve the survival in the fledgling phase of the life cycle by 10%, what would the population size be at t+1? (5 Marks)
Exercise III a: (Total Marks 34)
In this exercise you are presented with a hypothetical situation, where the Phoenix Park Nature Conservation Committee (PPNCC) has decided to reintroduce the red squirrel into the park. The intention is to establish a healthy squirrel population in the park and use it as a source for the reintroduction of the squirrel into other parts of Ireland. As a pre-requisite all the grey squirrels have been exterminated leaving this prime habitat open for the red squirrel to populate. You are given the task to predict when this squirrel population will establish a population of over 3000, at which time the excess animals can be used for other reintroduction programmes. Due to the usual budget constraints and because there is only one breeding programme in the country which supplies squirrels for such projects, you are provided with 200 1yr old females and 200 1yr old male red squirrels for introduction. You have searched the literature that is available for re-introduction programmes of this species and have come up with the following Life Table (females only) which has the population mortality and reproductive schedules necessary to answer the questions which follow (EIII Q1 – 6). We will assume a 50:50 sex ratio. In order to answer the questions you will have to generate a population projection table, i.e. a table with the squirrel age categories as columns and years of observation as rows. Remember to include one column that provides the total squirrel population in each year of observation. Please note we will assume in this exercise that when the squirrels are introduced that the 1yr old females will start reproducing in the year of introduction.
Red squirrel Life Table
| x | lx | qx | px | ex | mx | lxmx | lxmxx |
| <1yr | 1 | 0.65 | 0.35 | 1.09 | 0 | 0 | |
| 1yr | 0.35 | 0.5 | 0.5 | 1.47 | 1.2 | 0.6 | 0.6 |
| 2yr | 0.17 | 0.4 | 0.6 | 1.43 | 2.2 | 0.45 | 0.9 |
| 3yr | 0.10 | 1 | 0 | 1.05 | 2.4 | 0.27 | 0.81 |
| 4yr | 0 | 0 | 0 | 0 | 0 | 0 | 0 |
Q 1 At what life stage is the highest rate of mortality scheduled? (2 Marks)
Q2 At what age category is the highest birth rate estimated? (2 Marks)
Q3 At what rate is the population increasing after a period of 5 years? (10 Marks for population projection table & 5 Marks for answer to rate of increase)
Q4 When can the relocation of individuals begin? (5 Marks)
Q5 How many 1yr female individuals can be removed when the population reaches a total population size of 3000 (assume removal can only happen at the end of the year thus after the breeding season)? Remember the total population number can not drop below 3000 when the individuals are removed. (5 Marks)
Q6 If you did not have the Life Table but you knew the rate of increase which you calculated for Q3, how big would you predict your population to be at t+1 if at t you had 5431 individuals? (5 Marks)
Struggling with ENVB 30030 Ecology and its application: Population Ecology Assignment at UCD
UCD students often find the ENVB 30030 Population Ecology Practical Assignment challenging due to complex life tables, survivorship curves, and multi-step ecological calculations. Many struggle with Excel-based data analysis, mortality and survival rate estimation, or interpreting population structures correctly. There’s no need to worry—Ireland Assignment provides expert Population Ecology Assignment Help aligned fully with UCD academic standards. You can also review custom assignment samples to build trust and clarity.Hire our assignment help ireland and get your ENVB 30030 practical completed accurately and exclusively for you.