TI1102/TI1103 Geography in Action Assignment Brief 2026 | UOG
| University | University Of Galway (UOG) |
| Subject | TI1102/TI1103 Geography in Action |
TI1102/TI1103 Assignment Brief
Release Date: 03/07/2026 @ 12:00; Due Date: 07/08/2026 @ 17:00
Question 1
Data. You need to download the Excel file ‘Assignment.xlsx’ from the Second Sitting folder on Canvas.
Note: this file has two worksheets with different data:
Worksheet called ‘Velocity Area Method’.
Worksheet called ‘Recurrence interval’.
Question 1A. Calculate the River Lee discharge using the Velocity-Area Method
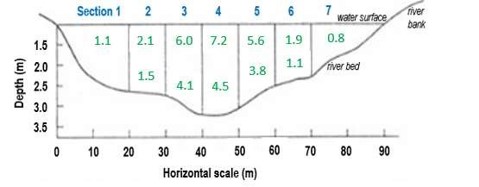
Open the Velocity-Area Method worksheet in the Assignment Excel file. Complete the table by filling in the blank cells. The flow velocity data you need for each section are provided below in GREEN in Figure 1 (e.g., section 1 has an average velocity of 1.1 ms-1; section 2 had velocity measured at 80% and 20% of flow depth to give 2.1 ms-1 and 1.5 ms-1, respectively; average flow for this section is 1.8 ms-1). We have provided the data for sections 1 and 2 in the Excel Table. You need to complete the calculations for Sections 3 to 7 in order to calculate the total discharge (= sum of values in Column 8).
[10 Points]
Figure 1.
In The Answer Sheet:
Fill in all the blank values in the Table 1 provided in the Answer Sheet (Q.1A). Fill in the total discharge value.
| Section | Flow velocity | Depth (m) | Width (m) | Area (m2) | Discharge (m3s-1) | ||
| 0.2d | 0.8d | Average | 5 x 6 | 4 x 7 | |||
| 1 | – | – | 1.1 | 0.8 | 20.0 | 16.0 | 17.6 |
| 2 | 2.1 | 1.5 | 1.8 | 1.6 | 10.0 | 16.0 | 25.6 |
| 3 | |||||||
| 4 | |||||||
| 5 | |||||||
| 6 | |||||||
| 7 | |||||||
| Total | |||||||
Question 1B. How long would it take the River Lee to fill Pearse Stadium?
The area of Pearse Stadium (the main playing surface) is approximately 10,400m2 (130 m long x 80 m wide). If the River Lee was draining into Pearse Stadium at the discharge rate you calculated, how many minutes would it take to fill up Pearse Stadium to the top of the stadium (assume the average top of the stadium is 40m above the playing surface)?
[10 Points]
Question 1C. Recurrence Interval & the 100 year flood
Open the Recurrence Interval worksheet in the Excel file. The data represent the annual peak discharge and water levels for the River Lee between 1999 and 2025 (27 records in total) extracted from a gauging station. Discharge is in units of ‘cumec’ which is one cubic metre of water per second, or m3s-1.
[40 Points]
Note: to answer the questions below you have to sort the data (highest to lowest); then rank the data (1 to 27); then calculate the Recurrence Interval for each event. After these steps you need to plot the data and show the linear regression trendline for the data.
In The Answer Sheet:
- Plot the Recurrence Interval the Peak Annual Discharge for the 27 records. Recurrence Interval (with units = years) has to be on the X-axis & Peak Annual Discharge (with units = m3/s) on the Y-axis.
Include the regression line and equation and R2 value on this graph.
Note: Your NAME and STUDENT ID have to appear on the graph axes; if they are absent you will not receive points.
In The Answer Sheet:
- Based only on the statistical regression equation you got in your graph, estimate the predicted discharge of a 100 year flood (please show how you derived your results and please list units).
- Discuss how confident you are in your prediction of the discharge of a 100-year flood event at this location. Your discussion should include a reference to the R2 value on the chart.
Note. Your answer should not exceed 100 words.
Question 2. Sustainable Urban Planning and Climate by exploring Terryland Forest Park.
What are ecosystem services?
“The social and economic benefits obtained by society from its use of the ecological functions of ecosystems” (Millennium Ecosystem Assessment, 2005) or, more simply, Ecosystem Services are “the benefits that Society receives from nature or Nature’s contributions to people.” We can extend this definition to the Terryland Forest Park: “Ecosystem services are provided by the processes, functions and structure of the park environment that directly or indirectly contribute to societal welfare, health and economic activities.”
It is important to note that the Ecosystem Services concept of a one-way flow of services to people is too simple. Human-ecosystem relations are reciprocal (Figure).
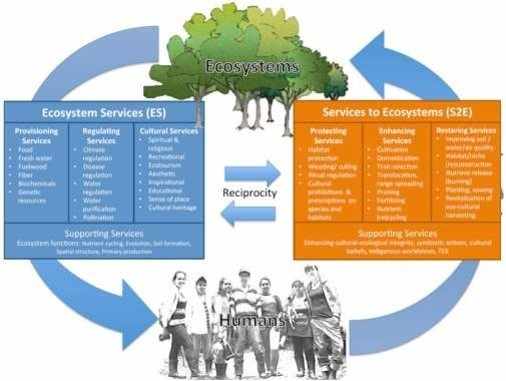
Figure. A framework showing the ES (Ecosystem Services) – S2E (Services to Ecosystems) loop of reciprocity. Source: Comberti et al., (2015).
[30 Points]
In The Answer Sheet:
- Explain the “loop of reciprocity” between humans and ecosystems as shown in the provided framework.
Note. Your answer should not exceed 100 words.
- Drawing on the “National Ecosystem and Ecosystem Services Mapping” project and the “Galway City Biodiversity Action Plan (2025-2030)” (see files provided on Canvas), assess how Terryland Forest Park contributes to Galway City’s strategies for (1) biodiversity, (2) climate change adaptation and (3) climate change mitigation.
Note. Your answer should not exceed 200 words each for (1) biodiversity, (2) climate change adaptation and (3) climate change mitigation.
Question 3. Referencing
[10 Points]
In The Answer Sheet:
Include citations for the following three resources using the “Guide to citing and referencing using the Harvard style” (all documents are provided on Canvas).
- The National Ecosystem and Ecosystem Services Mapping report
- The Galway City Biodiversity Action Plan (2025-2030) report
- The research article by Comberti et al (2015
Get Online TI1102/TI1103 Geography Assignment Help from Experienced UOG Experts
Are you looking for professional support with your TI1102/TI1103 assignment like many other UOG students? If you need a reliable assignment help, our experts provide geography assignment help tailored to your course requirements. You can also review UOG assignment examples and trust Ireland Assignments for high-quality solutions delivered on time.